SSP Fertilizer Manufacturing Cost Analysis: Full Breakdown
- 2026-05-29
Every serious fertilizer project developer eventually hits the same wall: the numbers look promising on the surface, but a proper SSP fertilizer manufacturing cost analysis reveals the real picture — and that picture is more layered than most initial feasibility summaries suggest. I’ve spent over twelve years working directly with SSP production facilities across Africa, South Asia, and the Middle East. The gap between a competent SSP fertilizer manufacturing cost analysis and a rough estimate can be the difference between a project that attracts investment and one that collapses six months after commissioning.
What Makes SSP Cost Analysis Different
Single superphosphate production seems straightforward on paper: phosphate rock meets sulfuric acid, the mixture acidulates, and you granulate the output. The chemistry is not the hard part. What makes a credible SSP fertilizer manufacturing cost analysis genuinely difficult is that the cost drivers interact in non-obvious ways — and most first-pass studies miss at least two or three of them.
Raw materials consistently account for 50–65% of total production costs. Phosphate rock grade and sourcing origin drive this figure harder than anything else. High-grade rock above 28% P₂O₅ reduces both input volume and acid consumption per tonne of SSP produced. Sulfuric acid is the second major input; operators who control their own acid supply through on-site production typically achieve $30–60 per tonne in operating cost savings versus spot purchasing. That changes the entire SSP plant investment calculus before you’ve written a single line of the business plan.
Energy costs typically account for 8%–12% of operating expenses for medium-sized plants. Compared to DAP and NPK production, SSP production has lower energy consumption, but the drying and granulation processes require a stable power supply. In areas with unstable power grids, diesel backup generators are needed, which can increase the energy cost per ton of product by 15%–20%. This cost often becomes apparent during post-production reviews but is rarely included in initial investment estimates.
Core Equipment: What You’re Actually Buying
A well-structured SSP plant investment requires getting the equipment list right from the start. Capital cost structure is only meaningful when tied to specific machine specifications, because the performance gap between well-specified equipment and budget alternatives shows up directly in maintenance cost and uptime over the first three to five years. Skipping this step is one of the most common ways developers undermine an otherwise sound SSP fertilizer manufacturing cost analysis.
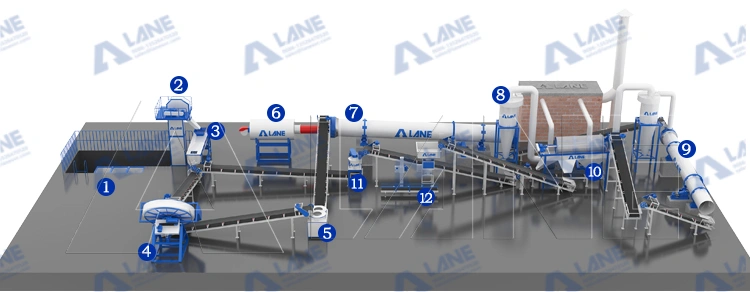
The primary equipment in a complete SSP production line:
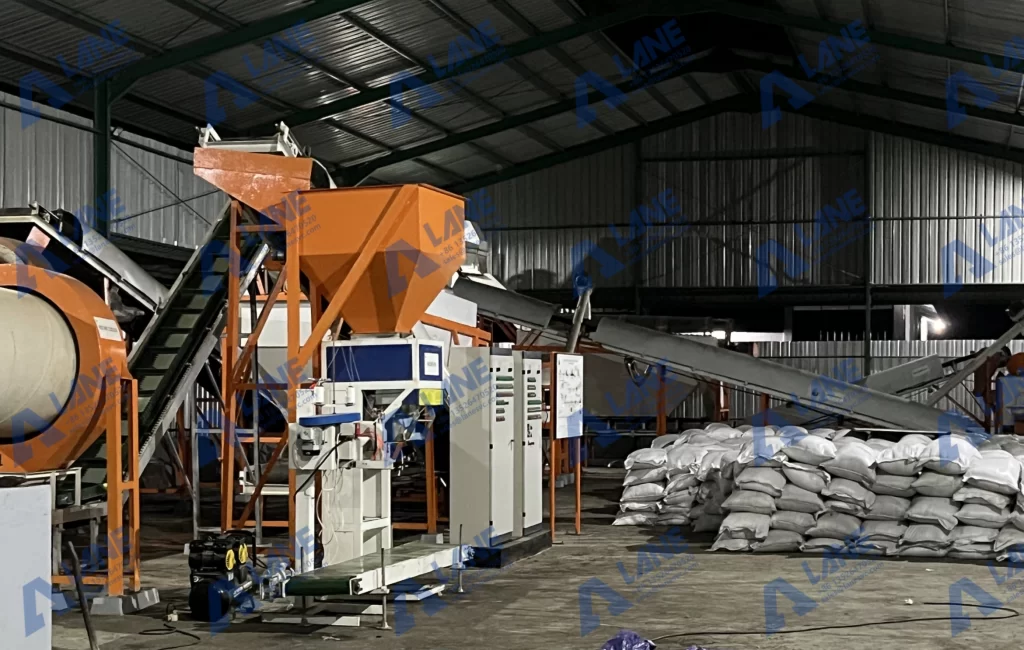
- Acidulation reactor: the reaction vessel where phosphate rock and sulfuric acid combine; residence time and acid ratio control product quality and available P₂O₅ content
- Raymond mill: grinds phosphate rock to required particle fineness before reaction; particle size distribution directly affects conversion efficiency downstream
- Belt conveyor system: transports material between all processing stages; undersized conveyors are a leading cause of unplanned downtime
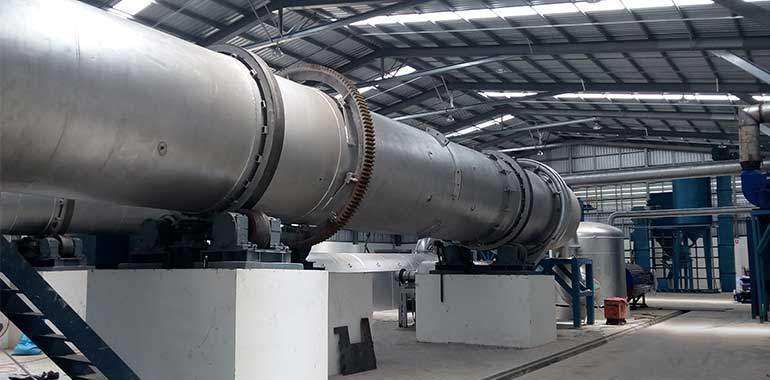
- Rotary drum granulator: forms cured SSP into uniform granules; granule size consistency affects buyer acceptance in commercial markets
- Rotary drum dryer: reduces post-granulation moisture to meet storage and packaging specifications
- Rotary drum cooler: brings product temperature down before screening to prevent caking
- Vibrating screen: separates on-spec granules from fines and oversized product; recycle loops return off-spec material to granulation
- Bag filter: dust collection across grinding and transfer points; required for regulatory compliance and raw material recovery
Based on field observations, if rotary drum granulators and cyclone dust collectors are under-specified, the corrective maintenance costs incurred by the plant within two to four years after commissioning will far exceed the savings made on equipment procurement. This is a common issue across all markets.
Equipment suppliers vary widely in process integration capability. Manufacturers such as LANE, a large-scale fertilizer production equipment producer based in Henan Province, China, offer complete SSP-specific lines covering rock grinding through bagging — meaningfully reducing integration risk for developers without dedicated in-house engineering teams.
Capital Cost Benchmarks
Any SSP fertilizer manufacturing cost analysis needs anchored capital figures, not order-of-magnitude guesses. Treat these as directional given steel price and currency volatility.
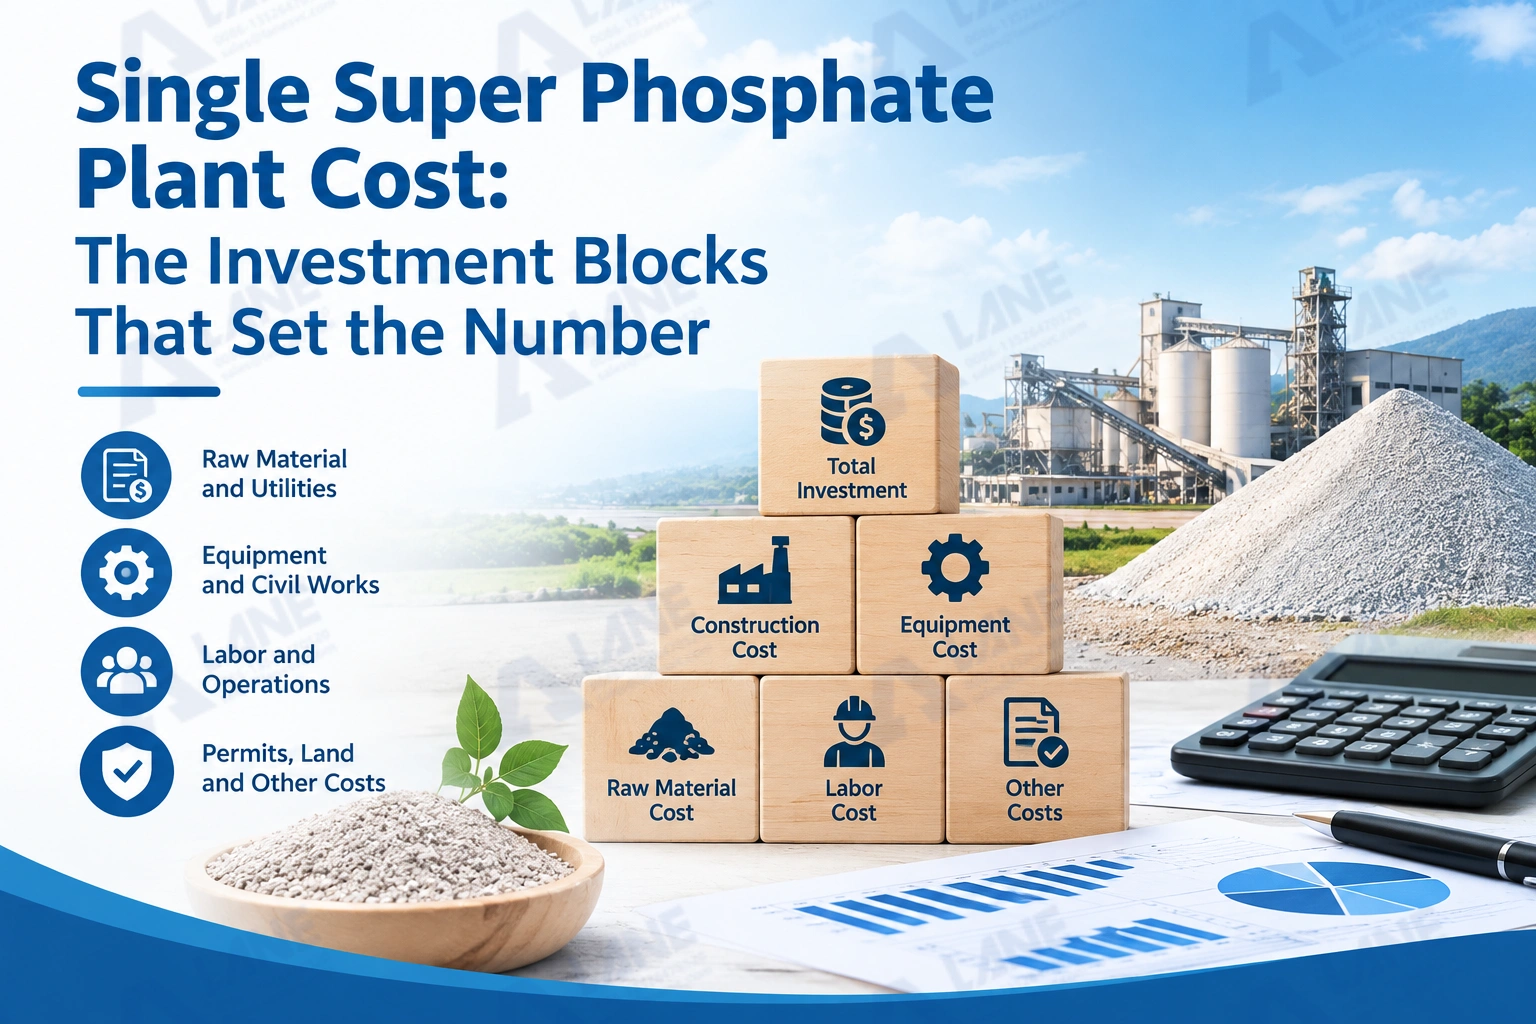
Small-scale plants producing 10,000–30,000 tonnes per year typically land between $800,000 and $2.5 million in total installed cost, heavily influenced by local civil works pricing. Mid-scale operations at 50,000–100,000 tonnes generally run $4–9 million. Fully integrated lines with on-site sulfuric acid production can push total SSP plant investment past $15 million at commercial scale.
For new projects in emerging markets, the actual cost often exceeds the initial budget by 20% to 30%. Unexpected civil engineering problems, such as soil conditions, drainage works, and access road modifications, result in additional expenses far exceeding the project’s planned expectations. This is not an isolated case, but a common phenomenon.
Operating Cost Structure
Beyond capital, a sound SSP fertilizer manufacturing cost analysis must model recurring costs accurately. Labour cost variance across markets is significant — a facility in Ethiopia operates with a fundamentally different wage structure than one in Malaysia. Maintenance typically runs 2–4% of total installed cost annually when equipment is well-specified. Packaging adds $8–15 per tonne depending on automation level and bag specification.
All-in production costs at an efficient mid-scale plant generally fall between $85 and $140 per tone of finished SSP, excluding capital amortization. When phosphate rock and sulfuric acid prices rise simultaneously — as happened sharply in 2021–2022 — thin-margin operations face serious pressure. A rigorous SSP fertilizer manufacturing cost analysis should model at minimum a base case, a stress scenario with raw materials 30% higher, and an upside case reflecting supply control. Development finance institutions increasingly require this sensitivity range before approving project financing.
Evaluating SSP Plant Investment: Final Considerations
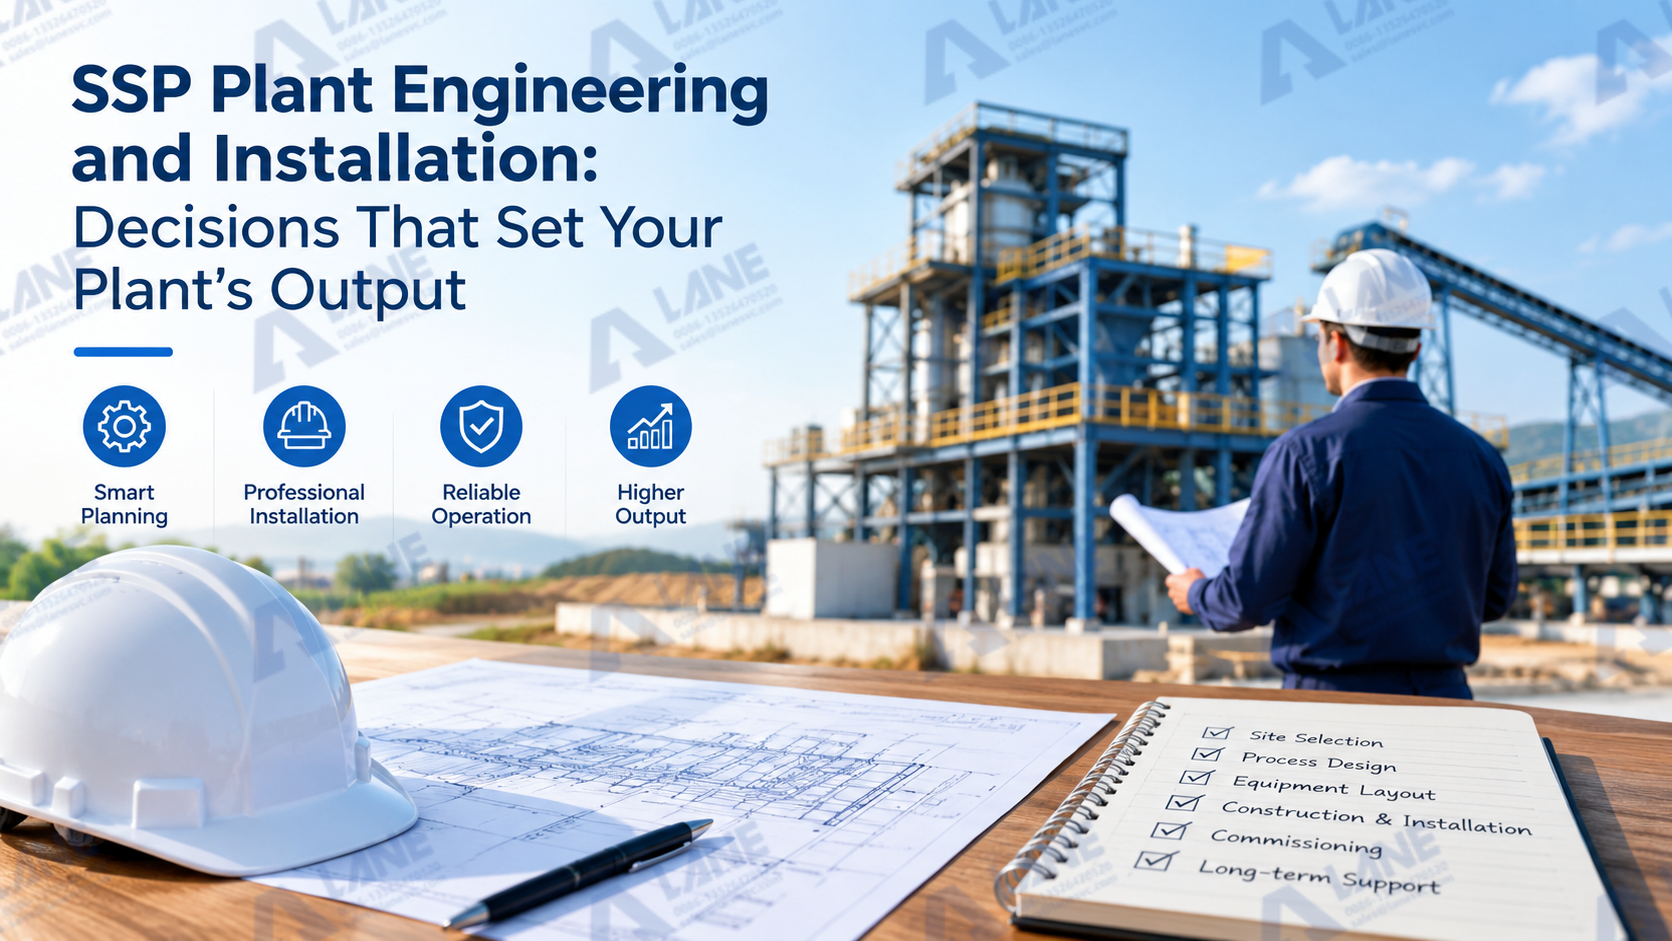
A thorough SSP plant investment appraisal is not a one-time deliverable. It needs to reflect actual equipment quotes, real logistics costs, and honest assumptions about operational efficiency ramp-up. Projects that treat cost analysis as a formality tend to face difficult investor conversations eighteen months after commissioning.
Conduct a rigorous SSP plant investment review early. Get specific equipment quotes. Pressure-test raw material sourcing assumptions. Build in contingency — not as a hedge, but because complexity in industrial construction is the rule, not the exception.
If you want to work through the cost model against your specific site, scale, and market conditions, contact our team for a detailed consultation.
Frequently Asked Questions
What is the typical payback period for an SSP plant investment?
Most mid-scale SSP operations running at 70–80% capacity recover initial capital within five to eight years, assuming stable phosphate rock supply and competitive local fertilizer pricing. Integrated operations with on-site acid production typically achieve faster payback due to lower per-tone operating costs.
How does phosphate rock quality affect SSP fertilizer manufacturing cost?
Rock grade has a direct multiplier effect on input consumption per ton of SSP produced. Higher-grade ore reduces both rock and acid requirements per unit of output. Lower-grade deposits may carry a lower per-tone price, but the conversion economics often make them more expensive in practice.
Is sulfuric acid integration worth the additional capital outlay during SSP plant investment planning?
For plants producing above 50,000 tones annually, integration generally makes financial sense. The capital addition — often $3–6 million for a basic contact process unit — is substantial, but per-tone acid cost savings improve project economics meaningfully over a ten-year operating horizon.
What hidden costs most commonly distort SSP fertilizer manufacturing cost analysis projections?
Civil works and site preparation consistently exceed estimates in markets with limited industrial construction infrastructure. Environmental permitting timelines in some jurisdictions add months to schedules, increasing financing costs. Workforce training for process control and safety is routinely underestimated in first-time operations.
How does plant scale affect per-tone production cost in an SSP plant investment?
Economies of scale matter considerably above 50,000 tones per year. Below 10,000 tones annually, SSP production is rarely competitive against imported product unless the operator holds a significant logistical or raw material supply advantage.
What financing structures are available for SSP plant projects?
Development finance institutions, commercial bank project finance, and equipment supplier financing are the primary routes. Projects in agricultural development priority regions sometimes qualify for concessional lending, which reduces the effective cost of capital and improves overall viability.
For more details, please feel free to contact us.
Henan Lane Heavy Industry Machinery Technology Co., Ltd.
Email: sales@lanesvc.com
Contact number: +86 13526470520
Whatsapp: +86 13526470520