Single Superphosphate Fertilizer Industry Trends: What Manufacturers and Investors Need to Know in 2026
- 2026-07-30
The single superphosphate fertilizer industry is not flashy. It does not attract venture capital headlines or trade-journal hype cycles. What it does is supply roughly 16.7% of the world’s phosphate fertilizer consumption, year after year, across markets where DAP and MAP are either too expensive or the wrong agronomic fit. SSP is the quiet workhorse of phosphate nutrition, and in 2026, the forces reshaping it deserve attention from anyone who builds, buys, or invests in fertilizer production capacity.
This article covers the market, production technology, plant economics, and equipment considerations that matter if you are evaluating an SSP manufacturing project or upgrading an existing line. No market-research-report abstractions. Just the trends that change what a plant looks like, what it costs, and where it should be built.
Market Landscape: Steady Growth, Regional Realignment
The global SSP market was worth roughly USD 3.3 to 3.5 billion in 2024 and is projected to reach USD 4.8 to 5.4 billion by 2032, growing at a compound annual rate of 4.0 to 4.6 percent. Those are consensus figures across multiple sources: GM Insights, 24ChemicalResearch, TechSci Research, and VPA Research all land within the same band, which is unusual for a commodity market and suggests the growth trajectory is structural rather than speculative.
What the headline numbers do not show is the regional rebalancing happening underneath.
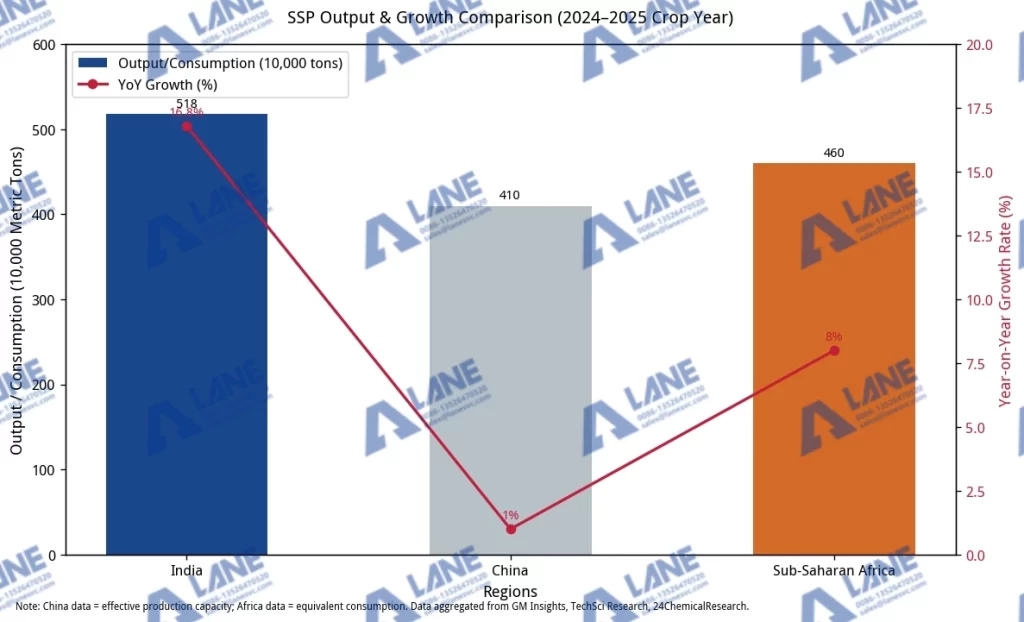
India is now the engine. Domestic SSP production hit 5.18 million metric tons in the 2024–25 crop year, a 16.8 percent jump year over year. The Nutrient-Based Subsidy scheme makes SSP the cheapest source of phosphate for smallholder farmers, and the government has been explicit about promoting it as a DAP substitute. Coromandel International alone runs 1 million tons of capacity, and regional producers like Rama Phosphates and Khaitan Chemicals are adding more.
China is consolidating, not growing. Environmental enforcement has shut more than 40 percent of SSP production capacity over the past decade. In Yunnan province, the number of SSP enterprises dropped from roughly 200 to about 20. What remains is larger, cleaner, and more automated, but China is no longer adding net SSP tonnage. It is exporting technology and engineering services instead, a shift that opens opportunities for non-Chinese equipment suppliers in third markets.
Africa and Southeast Asia are the next demand centers. Morocco’s OCP Group controls two-thirds of global phosphate rock reserves and is expanding downstream processing capacity. Sub-Saharan Africa, where phosphorus-deficient soils are the norm and DAP imports drain foreign exchange, is a logical growth market for locally produced SSP. Southeast Asian demand for oil-palm and rice fertilization is rising and under-served by domestic production.
The takeaway for a plant investor: do not assume yesterday’s supply map will look like tomorrow’s. The growth is in India, Africa, and Southeast Asia. Plant locations that sit close to phosphate rock sources and sulfuric acid supply, and that target these demand corridors, will have the structural cost advantage.
Production Technology: What Changed and What Matters
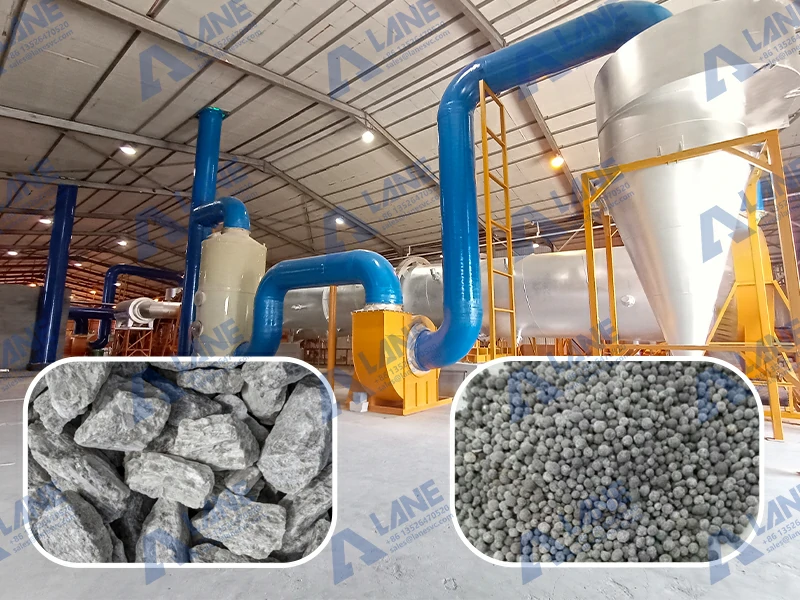
The core SSP production process has not changed in decades, and that is part of its appeal. Grind phosphate rock, mix it with sulfuric acid, let it react in a den, cure the product, and you have SSP. No high-pressure synthesis, no ammonia plant, no complex heat-recovery loop.
What has changed is the equipment technology around the edges, and for plant operators, these changes affect uptime, emissions compliance, and product consistency more than the core reaction ever did.
Phosphate rock reactivity varies by origin. Moroccan rock behaves differently from Chinese rock, which behaves differently from Florida rock. A ball mill or Bradley airswept mill that cannot hold a consistent 90 to 93 percent pass rate at 100 mesh will produce an uneven acidulation reaction. The result: pockets of unreacted rock in the den cake, low water-soluble P₂O₅, and an unhappy offtake customer.
Modern grinding circuits add real-time particle-size monitoring with automatic classifier adjustment. This is not exotic technology, but it is surprisingly absent from older plants, and it explains a lot of product-quality variation in the market.
The paddle mixer or cone mixer where rock meets acid is the point where yield is won or lost. Too little acid and the reaction does not complete. Too much and you waste sulfuric acid, which at current prices costs roughly USD 100 to 150 per ton, while producing a sticky, poorly curing cake. PLC-controlled acid-to-rock ratio systems with continuous weigh-feed input are now standard on new plants and should be budgeted as baseline, not optional.
Den design
The Broadfield-type moving-slat den, enclosed and gas-tight, remains the industry standard for a reason. It works. What has improved is the automation layer: reciprocating den sides to prevent wall sticking, automated cutter speed synchronized with den speed, and full gas capture to the scrubbing system. A well-designed den now runs at 60 to 110 percent of rated capacity without mechanical issues, which gives operators genuine production flexibility.
Gas scrubbing and environmental compliance
This is where regulation has tightened most visibly. Fluorine gases (HF, SiF₄) released during acidulation must be captured and scrubbed. Modern multi-stage venturi scrubber systems reduce fluorine emissions below 5 mg per cubic meter, and the scrubbing liquor can be recycled back into the acid dilution stage for a zero-liquid-effluent design. Plants that skimp on scrubbing eventually pay for it in enforcement actions and community relations. In the EU, cadmium limits in phosphate fertilizers are an additional layer, and sourcing low-cadmium rock (mostly from igneous deposits in Russia, South Africa, and Brazil) is becoming a competitive differentiator for export-oriented SSP producers.
Plant Investment: What an SSP Line Actually Costs
There are two ways to think about SSP plant cost: the equipment bill and the total project cost. They are not the same number, and confusing them is the most common mistake first-time investors make.
Equipment costs (free-on-board supplier)
For a complete SSP production line, from rock receiving through cured product storage, equipment costs scale roughly as follows, based on multiple manufacturer quotations and project reports:
| Annual Capacity | Core Equipment Cost (USD) | Includes |
|---|---|---|
| 20,000 tons/year | 100,000 to 200,000 | Crusher, ball mill, mixer, den, scrubber, conveyors, basic control |
| 50,000 tons/year | 200,000 to 400,000 | Above plus automated weighing, larger grinding, enclosed den |
| 100,000 tons/year | 400,000 to 600,000 | Above plus PLC control, granulation module (for GSSP), dryer, cooler, screens |
Adding a granulation line to produce granulated SSP typically adds 30 to 50 percent to the equipment cost. If ammoniation is included, budget for ammonia storage, dosing, and additional scrubbing.
Total project cost
Total installed cost is typically 2 to 3 times the equipment cost once you factor in land, civil works (foundations, curing shed, acid storage bunds), utilities (power connection, water supply), engineering, commissioning, and working capital for initial raw material inventory. A 50,000-ton-per-year plant with granulation lands somewhere between USD 500,000 and 1.2 million total installed cost, depending on location and site conditions.
Operating cost structure
Raw materials run the show. Phosphate rock and sulfuric acid together account for 70 to 80 percent of operating costs. A 200-ton-per-day plant consumes roughly 3,500 metric tons of rock and 2,200 metric tons of sulfuric acid per month. At mid-2026 pricing, that is a significant monthly procurement bill, and margins swing on the spread between input costs and SSP selling price. Plants with long-term rock and acid supply contracts, or those co-located with phosphate mines and sulfur-burning acid plants, have a structural margin advantage that standalone plants cannot replicate.
The payback math is still attractive. Gross margins of 20 to 30 percent and net margins of 8 to 15 percent support a 1.5 to 3 year payback period on well-located plants running at high utilization. Government fertilizer subsidies in India and parts of Africa shorten this further.
What Industry Trends Mean for Equipment Buyers
If you are procuring SSP production equipment in 2026, four trends should shape your specification.
First, modularity matters more than maximum capacity. The market is moving toward plants that can start at 50 to 100 tons per day and scale up by adding parallel lines, rather than one oversized line that must run at full tilt to break even. This is especially true in Africa and Southeast Asia, where market development may take several seasons and a 1,000-ton-per-day plant would sit idle.
Second, fortified SSP is the growth product. Zincated SSP and boronated SSP carry price premiums of 15 to 25 percent over commodity SSP in the Indian and African markets. Adding a micronutrient dosing system to the granulation circuit costs perhaps USD 15,000 to 30,000 and opens a higher-margin product category. If your granulation line cannot do this, it is worth the retrofit.
Third, energy efficiency is becoming a negotiation point. The difference between a well-designed rotary dryer with heat recovery and a basic unit is 15 to 25 percent on fuel consumption. At current natural gas and coal prices, that difference recovers the equipment premium in under two years.
Fourth, automation and data logging are no longer optional for export-oriented plants. Buyers in regulated markets increasingly want batch traceability: which rock shipment, which acid lot, which curing period, which quality test results. A PLC system that logs production parameters and ties them to batch numbers costs more upfront but makes commercial quality disputes much easier to resolve.
Regional Opportunity Map
India remains the largest and most accessible SSP market for equipment suppliers. The government is actively promoting domestic SSP production. The challenge is price sensitivity: Indian buyers negotiate hard, and the competitive set includes established domestic equipment manufacturers. The opportunity is in higher-specification equipment (automated control, granulation, scrubbing) where local options are thinner.
Sub-Saharan Africa is the highest-upside region for new plant construction. Soil phosphorus deficiency is near-universal, fertilizer application rates are among the lowest in the world, and several governments (Ethiopia, Nigeria, Kenya, Tanzania) have fertilizer-sector development programs. The challenge is infrastructure: reliable power, water, and logistics cannot be assumed. Containerized or skid-mounted modular plants that minimize on-site civil works are a genuine product-market fit here.
Southeast Asia has growing demand for oil-palm, rice, and cassava fertilization, limited domestic phosphate production, and reasonable infrastructure. Vietnam, Indonesia, and the Philippines are the priority markets. Plants in the 50,000 to 100,000-ton-per-year range are the sweet spot.
North America and Europe are replacement and modernization markets, not greenfield growth markets. The opportunity is in upgrading existing plants with better scrubbing, automation, and energy-recovery systems to meet tightening environmental standards.
Frequently Asked Questions
Q: Is SSP still competitive against DAP and MAP?
Yes, for specific use cases. SSP delivers phosphorus at a lower cost per unit than DAP in most markets, and it carries 10 to 12 percent sulfur and 18 to 21 percent calcium that DAP and MAP do not. For oilseeds, pulses, and legumes, SSP is often the agronomic preference regardless of price. The limitation is nutrient concentration: at 16 to 22 percent P₂O₅ versus DAP’s 46 percent, SSP costs more to transport and apply per unit of phosphorus. This makes SSP most competitive when production is close to consumption, which is exactly the regional production model that is expanding.
Q: What is the minimum viable plant capacity for SSP?
Economically, about 20,000 tons per year (roughly 65 to 70 tons per day). Below that, the fixed costs of grinding, gas scrubbing, and quality control infrastructure eat too much of the margin. Technically, smaller plants exist, but they struggle to produce consistent quality and meet environmental standards.
Q: How long does it take to commission an SSP plant?
A modular plant in the 50 to 100 ton-per-day range can be commissioned in 5 to 8 months from equipment delivery, assuming civil works are complete. Larger turnkey plants take 12 to 18 months. The critical path items are the den conveyor (which is custom-fabricated to length), the scrubbing system (which requires on-site ductwork), and the power connection.
Q: What is the biggest equipment maintenance headache in an SSP plant?
Corrosion, everywhere, all the time. Sulfuric acid and hydrofluoric acid vapor attack mild steel aggressively. The mixer, den structure, gas ducts, and scrubber internals must be rubber-lined, brick-lined, or built from 316L stainless steel. Cutting corners on corrosion protection saves capital and guarantees premature failure.
Q: Can an SSP plant produce other phosphate fertilizers?
Not directly. SSP is a single-product process. TSP (triple superphosphate) uses phosphoric acid instead of sulfuric acid and requires different equipment. That said, a plant with a granulation circuit can produce both powdered SSP and granulated SSP from the same upstream process, which is the most common way to diversify the product range without major additional investment.
Q: What return on investment should I expect from an SSP plant?
Gross margins of 20 to 30 percent and net margins of 8 to 15 percent are achievable for well-located plants with reliable raw material supply and consistent offtake. Payback of 1.5 to 3 years is typical. The variables that move ROI the most are rock phosphate procurement cost (difference between contract and spot pricing can swing margins by 5 to 8 points) and capacity utilization (plants running below 70 percent of nameplate capacity rarely turn a profit).
Q: Is granulated SSP worth the additional equipment investment?
For most commercial plants, yes. Granulated SSP (2 to 4 mm particles) handles better, blends better with other granular fertilizers, applies more evenly through broadcast spreaders, and commands a price premium of 5 to 10 percent over powdered SSP in most markets. The additional equipment (granulator drum, dryer, cooler, screens) adds 30 to 50 percent to the equipment cost but typically pays back within 2 to 3 years through the price premium and reduced caking and handling losses.
Where the Industry Is Heading
The SSP industry is not going to double in size in five years, but it is also not going away. Phosphorus is an essential plant nutrient with no substitute, phosphate rock reserves are finite and geographically concentrated, and the economics of SSP make it the rational phosphate source for a large and growing share of the world’s farmland.
The plants being built today are cleaner, more automated, and more flexible than the ones they replace. They produce fortified products for specific crop needs. They capture emissions and recycle waste streams. They sit closer to raw materials and closer to customers. That is the trend, and it runs deeper than a quarterly price chart.
For equipment buyers and plant investors, the question is not whether the SSP market is growing. It is. The question is whether you are building the kind of plant that fits where the market is going, or the kind of plant that fit where the market was ten years ago.
For technical consultation on SSP production line design, equipment specification, or turnkey plant projects, contact LANE Machinery’s engineering team.