How to Read an SSP Manufacturing Process Diagram: From Raw Phosphate to Finished Fertilizer
- 2026-04-07
If you’ve ever pulled up an SSP manufacturing process diagram expecting a clean, intuitive visual — and instead found yourself staring at a dense tangle of arrows, vessels, and labeled feed lines — well, that’s a pretty common first reaction. These diagrams are designed for engineers, not casual readers, and they condense a significant amount of process logic into a compact space. But here’s the thing: once you understand the underlying sequence, the layout starts to feel almost obvious. The confusion doesn’t last.
This guide walks through how to read an SSP manufacturing process diagram from start to finish. Whether you’re evaluating an equipment supplier, reviewing a plant layout for commissioning, or seeking a deeper understanding of the SSP process, this overview provides a clear foundation for every stage.
What Is an SSP Manufacturing Process Diagram, really?
An SSP manufacturing process diagram is basically a flow chart. It traces the path of raw phosphate rock through a sequence of chemical and mechanical processing stages, ultimately producing single superphosphate — a finished fertilizer containing approximately 16–20% available P₂O₅. Each box represents a specific piece of equipment, while each arrow indicates a material stream. Labeled lines provide key process data, such as temperature, feed rate, or chemical state at each stage.
Engineers reach for the SSP manufacturing process diagram throughout a plant’s life — during initial design, during commissioning, and during day-to-day operations when something needs to be traced back. Procurement teams use it when identifying replacement components. And if you’re a buyer evaluating competing production lines, a well-constructed SSP fertilizer manufacturing diagram tells you more about a supplier’s engineering depth than any brochure ever will. Vague diagrams tend to reflect vague engineering.

The Key Equipment Stages You’ll See on the Diagram
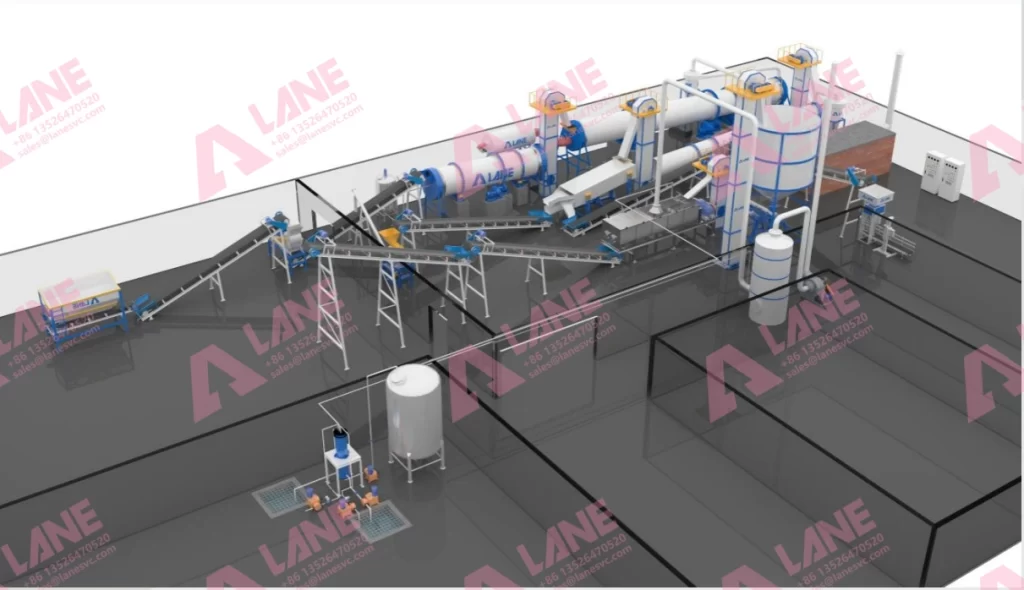
Most SSP manufacturing process diagrams follow the same general sequence. Here’s what to look for, and the professional equipment names you’ll encounter:
Phosphate Rock Storage and Feeding System — Everything starts here. Raw phosphate rock is stored in a feed hopper or surge bin and then metered into the process using a belt feeder or vibrating feeder. Maintaining a consistent feed rate is more important than many operators realize, as even minor upstream fluctuations can lead to product quality issues that are difficult to correct downstream.
Sulfuric Acid Dosing System — Sulfuric acid, usually at 68–70% concentration, enters through an acid metering pump and converges with the rock feed in the mixing zone. On any SSP manufacturing process diagram, this stream typically appears as a separate line feeding into the reaction stage. The acid-to-rock ratio is among the tightest controlled variables in the entire process.
Den Reactor— The reactor is the heart of the entire operation. Inside the den reactor—a large, mechanically agitated vessel—phosphate rock reacts with sulfuric acid to form a semi-solid slurry of monocalcium phosphate and calcium sulfate. The reaction typically takes 20 to 30 minutes, and the conditions in the reactor ultimately determine the upper limit of final product quality.
Belt Conveyor — After discharge from the den, the reacted mass moves by belt conveyor into a curing warehouse. How long it cures depends on the plant design; some setups run a few days, others several weeks. Diagrams for plants with humidity-sensitive curing areas often include ventilation detail at this stage.
Double Shaft Mixer — Before granulation, the cured material is first broken down and conditioned. This step is typically carried out in a double-shaft mixer or cage mill, which homogenizes the material and adjusts it to the proper consistency for the next stage. Although this operation can seem minor in a process flow diagram, its impact is immediately evident in granule quality if it is omitted.
Rotary Drum Granulator — Hard to miss on any SSP fertilizer manufacturing diagram, the rotary drum granulator is where loose, conditioned material gets tumbled with controlled moisture additions until uniform granules form. Rotation speed and drum angle are calibrated to target granule size ranges.
Rotary Drum Dryer and Cooler—Fresh granules exiting the granulator contain excess moisture. In the rotary drum dryer, the moisture content is reduced to below 5% through controlled heating and airflow as the material tumbles inside the drum. Immediately afterward, the hot granules are cooled in a rotary drum cooler to prevent breakage and caking during the subsequent screening stage.
Vibrating Screen — Cooled granules pass over a vibrating screen and get sorted: on-spec product moves ahead, oversized particles go to a crusher and recycle back, and fines loop back to the granulator. That recycle loop is a defining feature of any properly drawn SSP manufacturing process diagram — its absence is a red flag.
Coating Machine — This is the final step before bagging or bulk loading. In the coating machine, a thin surface treatment is applied to reduce dust generation and improve shelf life. The finished product is then transferred by conveyor to storage or dispatch.
How to Follow the Flow
The most useful habit I developed—after years of reviewing plant diagrams with commissioning and operations teams—is to follow the material flow first, rather than focusing on the equipment labels. Start by tracing the phosphate rock from entry to exit. Then go back and follow the acid flow paths. After that, identify the recycle streams. This three-pass approach helps build a clear mental model of how the process actually operates, rather than simply showing what equipment is installed.
One thing that catches a lot of readers off guard the first time: the off-gas treatment system. Fluorine-containing gases are released during acidulation, and any complete SSP manufacturing process diagram will show a scrubber system — typically a venturi scrubber or packed tower — tied into the den reactor and dryer exhaust. If that system is missing from the diagram, or if it appears to have been added as an afterthought, it is worth asking the supplier for a clearer explanation.
FAQ
Q: What’s the difference between an SSP manufacturing process diagram and a PFD?
Both serve similar documentation purposes, but a full process flow diagram (PFD) layer in additional data — stream compositions, volumetric flow rates, and operating temperatures. The SSP manufacturing process diagram you’ll encounter in technical proposals or sales materials is usually a simplified version. It shows the process sequence without the full quantitative overlay of a PFD.
Q: Can one diagram cover both SSP and TSP production?
Not with any real accuracy. Triple superphosphate production involves different acid concentrations and reaction conditions, so the two processes diverge in several important ways. Any diagram that claims to represent both without clearly distinguishing the process paths should raise follow-up questions. Any credible SSP manufacturing process diagram should be specific to a single production pathway.
Q: How do I use an SSP fertilizer manufacturing diagram to evaluate a supplier?
Look for completeness. Does the diagram show the full recycle loop? Is the off-gas treatment system clearly represented? Are instrumentation and control points labeled? Manufacturers such as LANE, which supply complete SSP production lines, typically include detailed process diagrams in their technical proposals, and the quality of that documentation often reflects the rigor of the underlying engineering.
Q: Is the diagram the same for small-scale and large-scale plants?
The process sequence is the same. What changes are unit sizing, the number of parallel production lines, and how much automation is represented? A smaller plant might show a single granulation train; a large-capacity facility often shows multiple parallel streams feeding into shared utility systems. Either way, a properly drawn SSP manufacturing process diagram should remain readable and logically sequenced regardless of plant scale.
Reading an SSP manufacturing process diagram fluently isn’t a skill reserved for process engineers. Anyone involved in evaluating, procuring, or operating SSP equipment benefits from being able to interpret these diagrams confidently and without confusion. The underlying process logic is consistent enough that, once understood, it applies across different plant designs and supplier formats. That familiarity becomes especially valuable when meeting with equipment vendors and knowing which questions to ask.
For more details, please feel free to contact us.
Henan Lane Heavy Industry Machinery Technology Co., Ltd.
Email: sales@lanesvc.com
Contact number: +86 13526470520
Whatsapp: +86 13526470520